Does the growing middle-market offer hope for SA's future?
WhyFive's BrandMapp insights on the taxpaying population over the past decade reveal that it's not all 'doom and gloom' for SA Inc
10 August 2023 - 09:49

According to WhyFive's BrandMapp insights, the percentage of adults in middle-market households who have a university degree has grown from 24% to 34% over the past decade. Image: 23RF/tuiphotoengineer
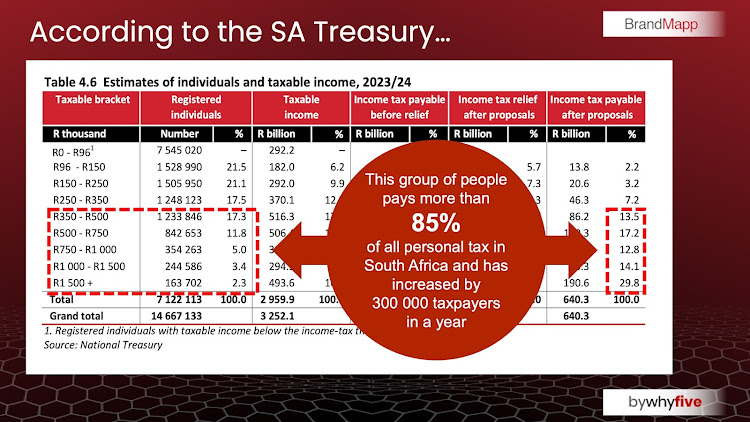
Image: WhyFive/BrandMapp
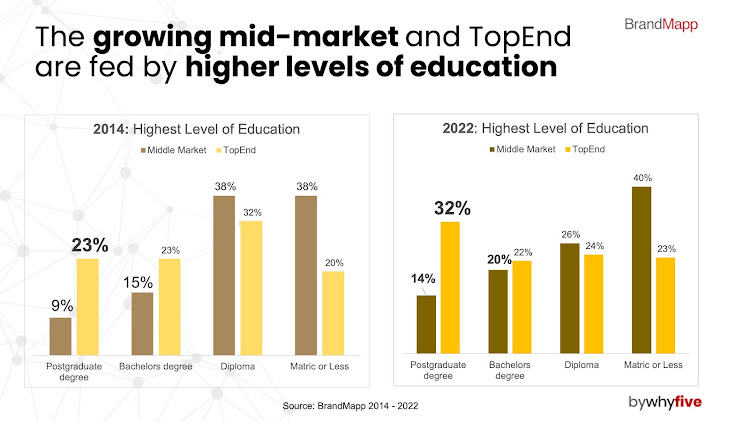
Image: WhyFive/BrandMapp
Image: WhyFive/BrandMapp

Image: WhyFive/BrandMapp